UPDATE: This post is from an older version of Cauldron. See Set up a project analysis for a more recent version
This post is a tutorial on how to set up a project analysis and visualize the data in Kibana. In the end you will be able to obtain metrics related to the projects that matter to you and their evolution. In this case we are going to carry out an analysis of Django and see its evolution during its lifetime.
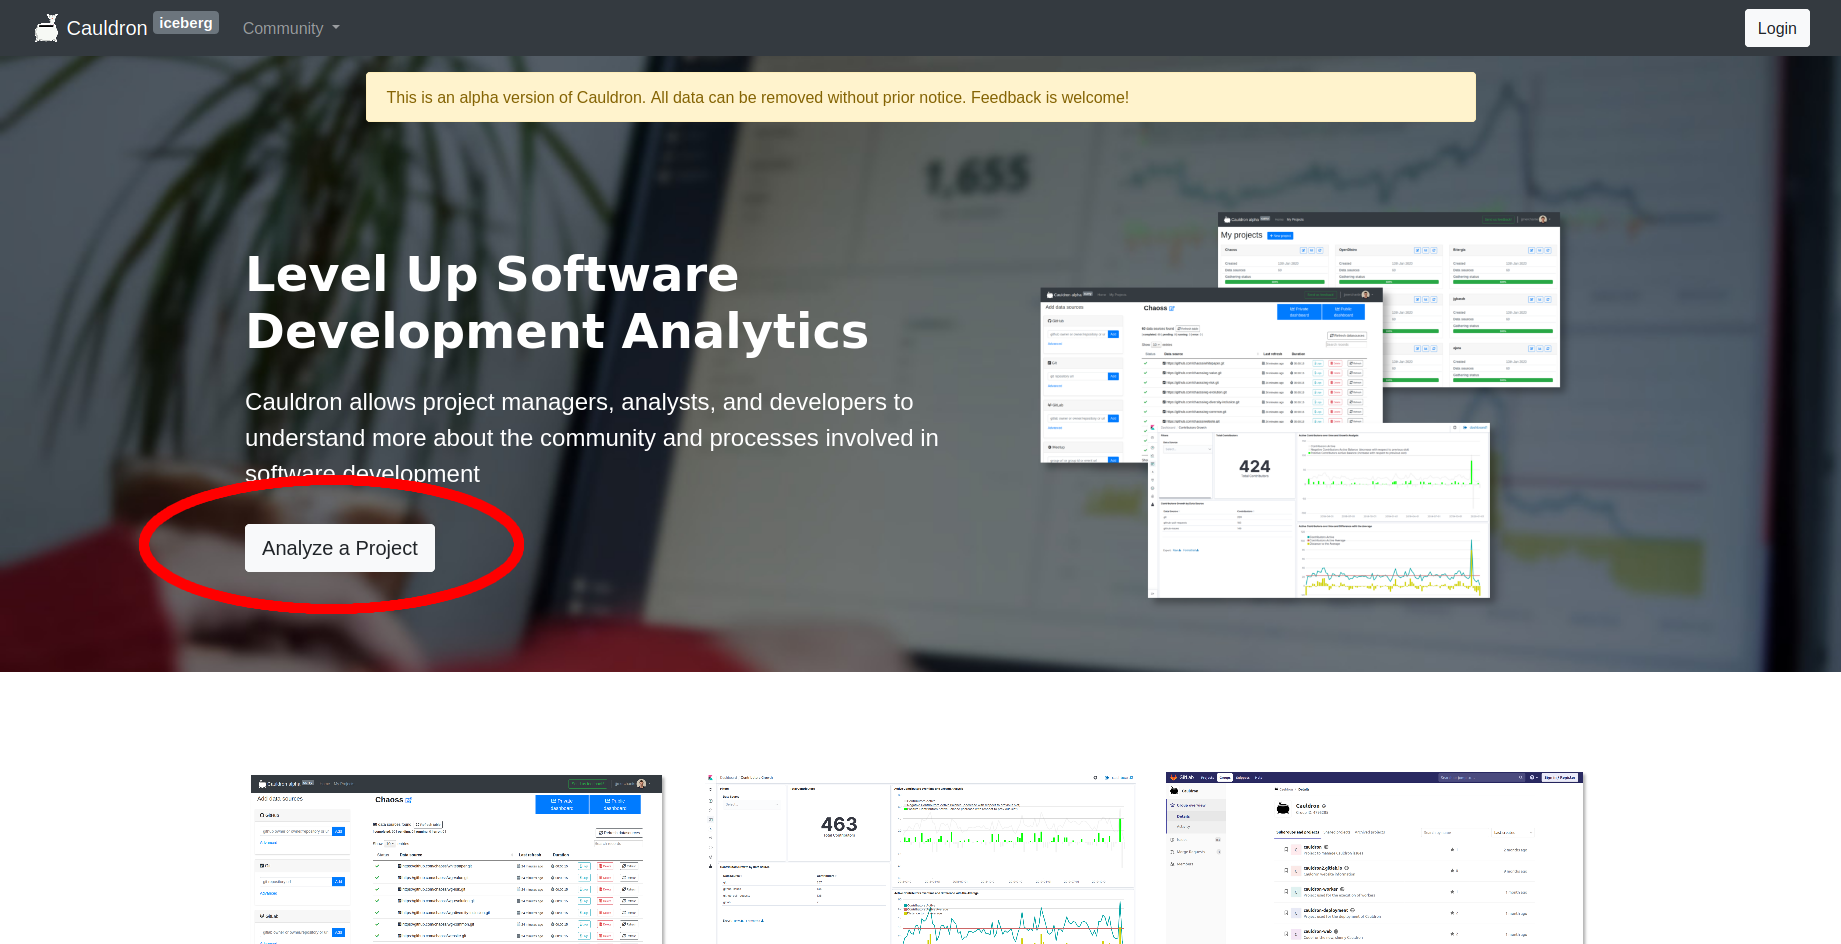
First of all, to create a new project, go to cauldron.io and click on Analyze a project:
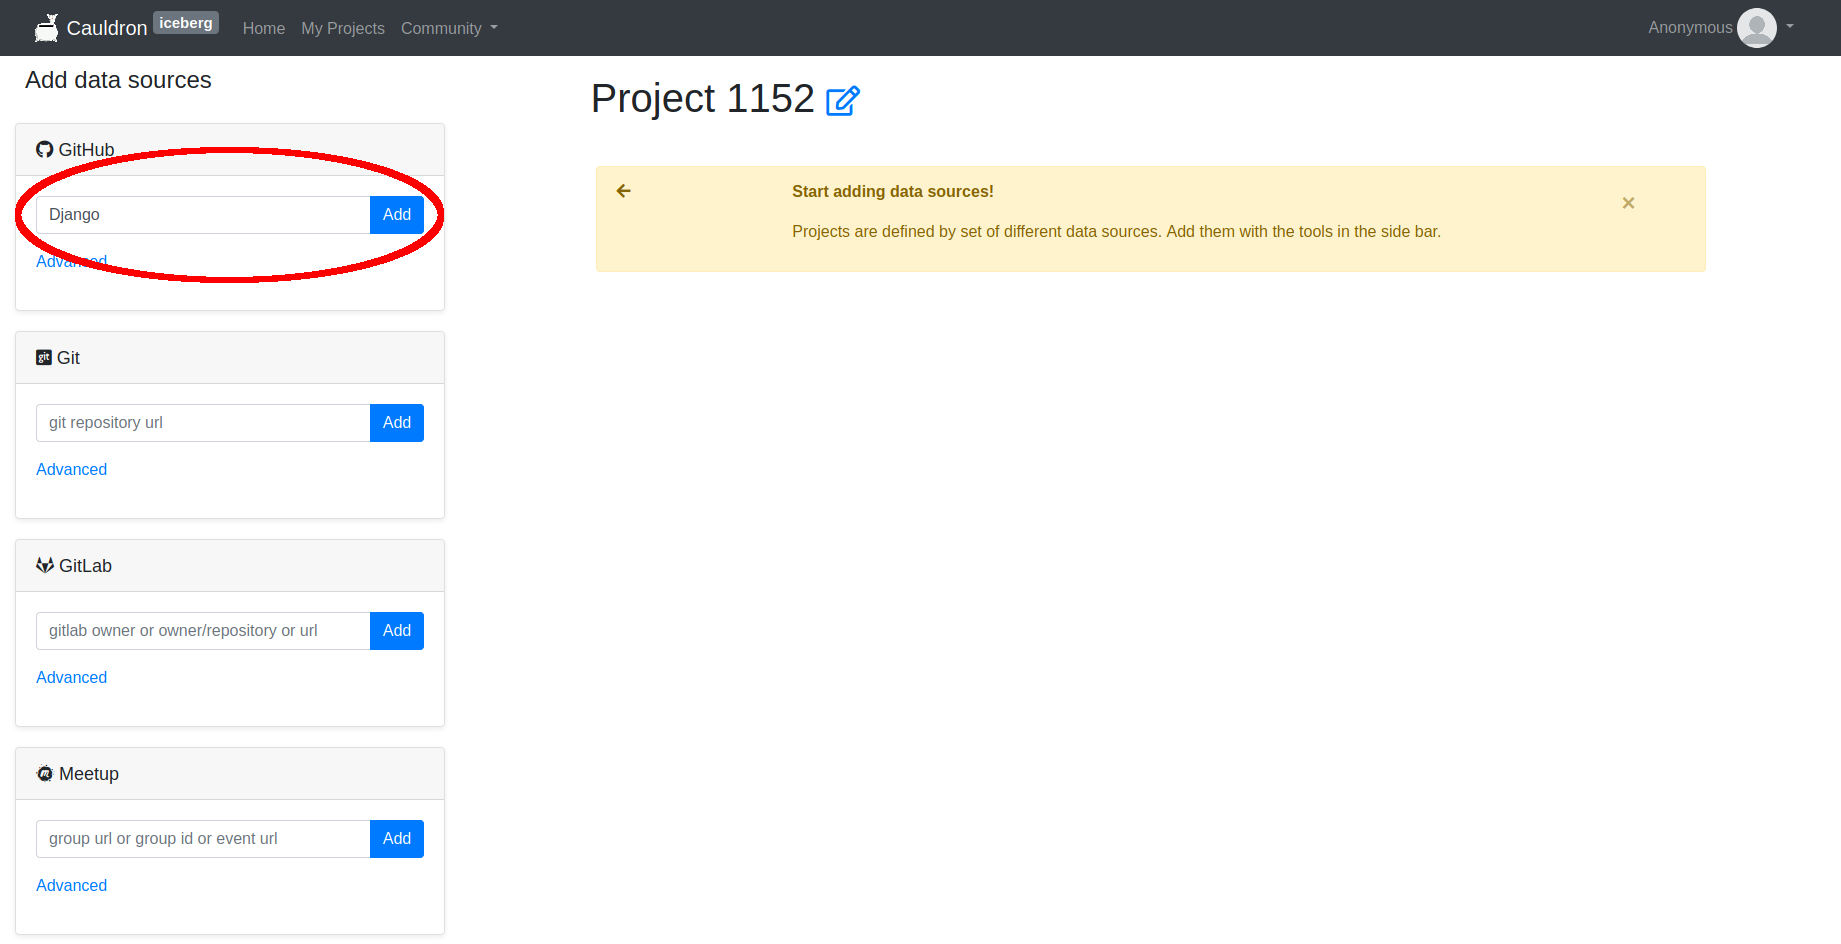
On the left of your project page, there will be a list of the data sources that can be added. You can enter in the form the URL of the repository that you want to analyze or a GitHub/Gitlab/Meetup username to analyze all its repositories. In our case we will add Django.
Unless you want to analyze only Git repositories, you will be asked to authenticate yourself at the data source to obtain your data collection token. An account will be created in Cauldron that will allow you to return to get the results.
You can repeat the process of adding repositories as many times as you want until completing your project. Remember that the more repositories you add, the longer your analysis will take. The repositories you request will begin to be analyzed the moment they are submited.
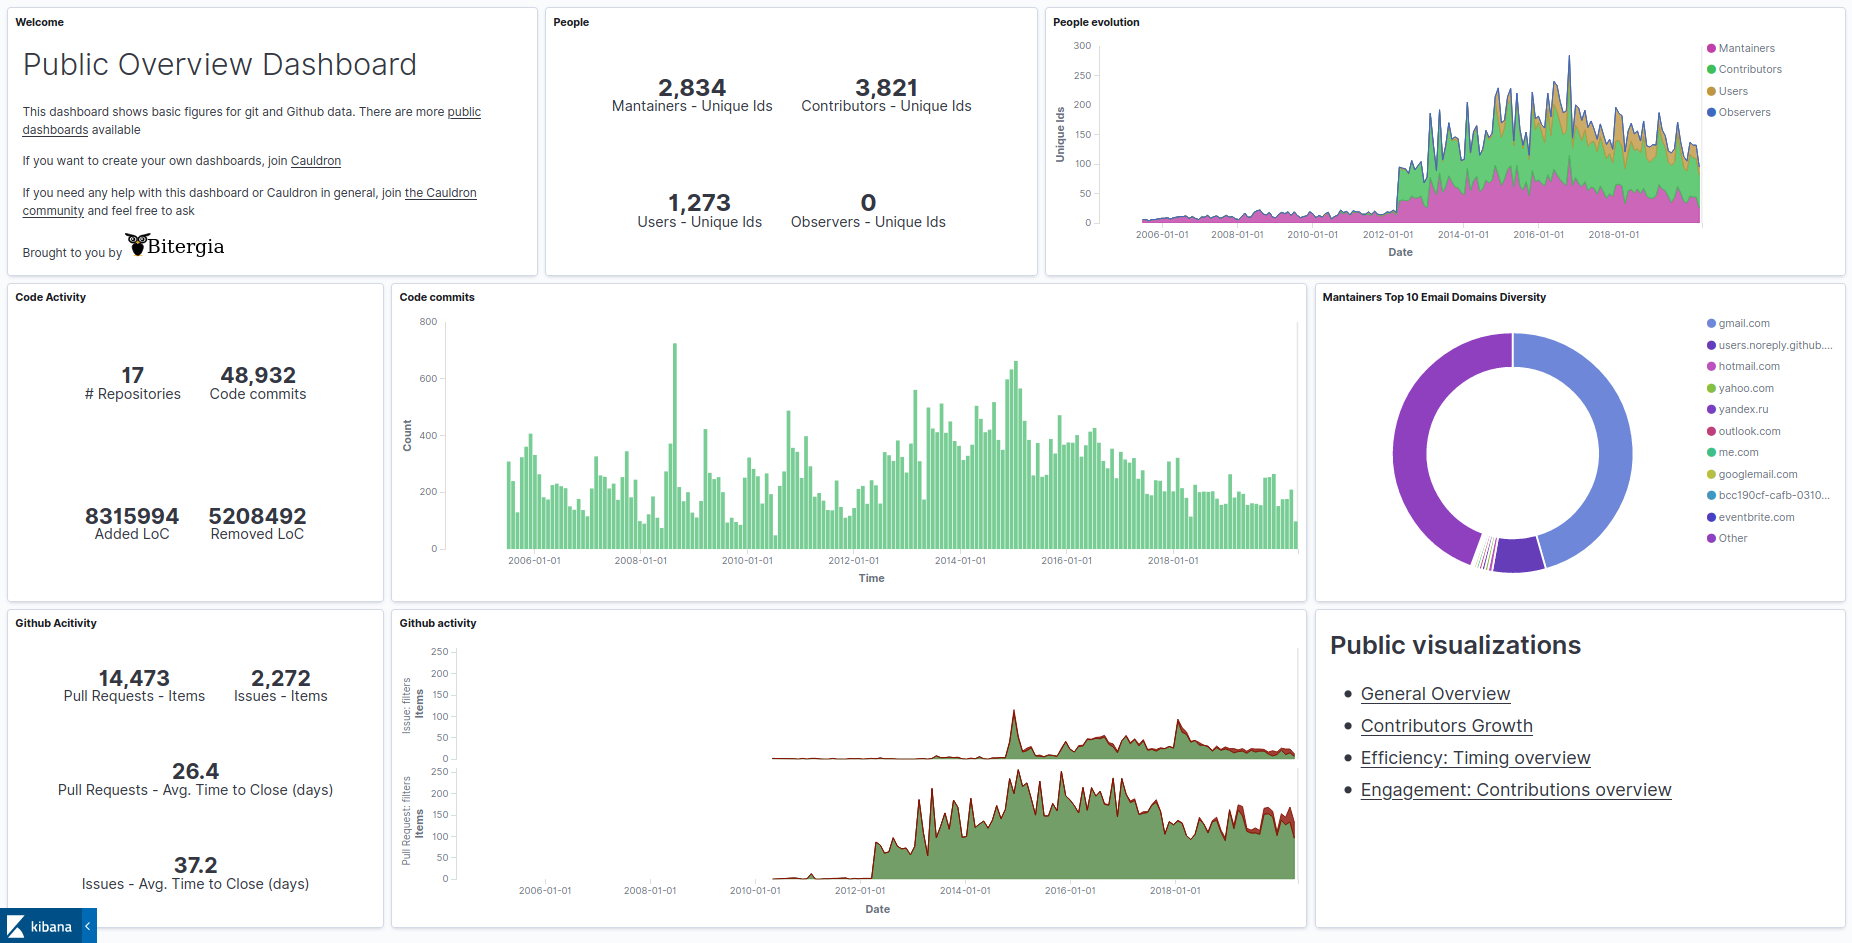
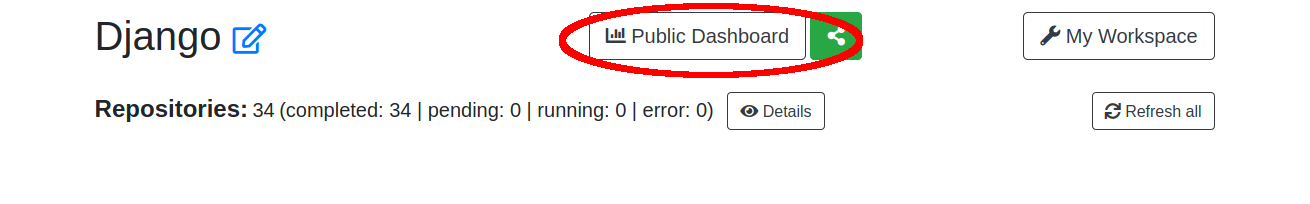
After your repositories have been analyzed (it may take some minutes or hours depending on your analysis), you can access the public dashboard to see the predefined visualizations created for Cauldron.
You can access to the dashboard from this link, but we recommend you to follow the steps and create your own one. In future posts, we will show you how to create your own visualizations and play with the data. Stay tuned!
Your,
Cauldron.io Team