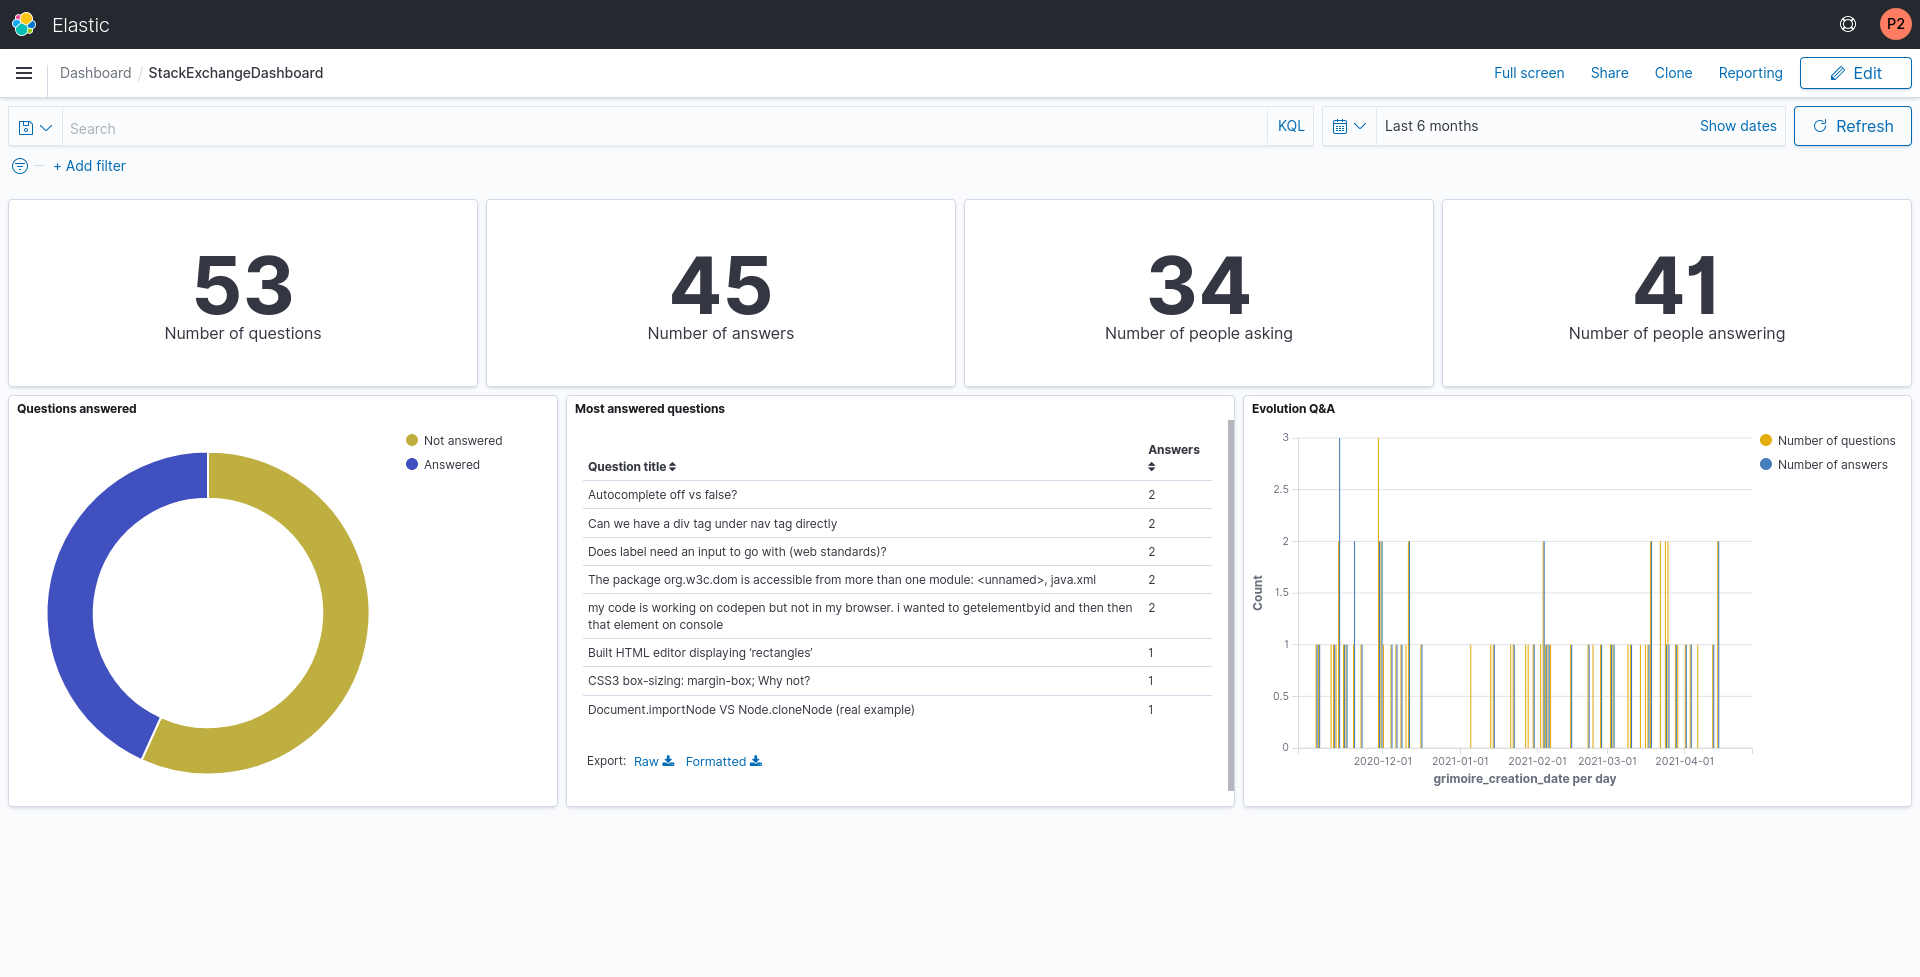
Two releases ago we introduced a new backend to Cauldron: StackExchange. With this new acquisition, users could analyze the tags they wanted from any of the sites that StackExchange manages (StackOverflow, AskUbuntu, etc). At the time we included some small metrics and graphs, as well as a dashboard in Kibana.
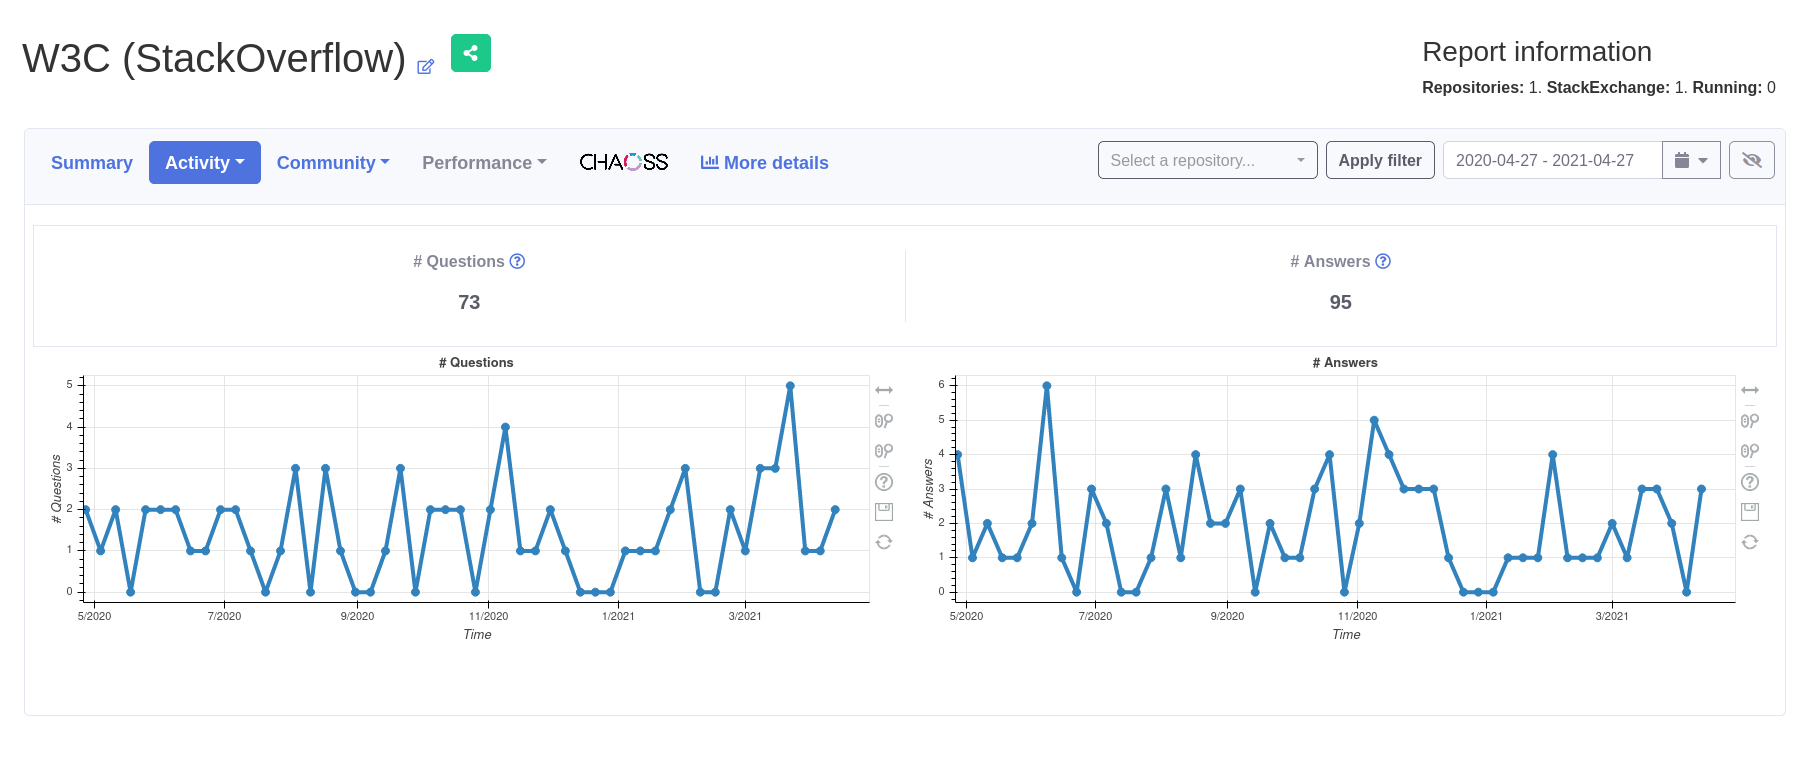
Today we want to present a new section within the project metrics that we have called “Q&A”. This new section is found within the “Activity” and “Community” sections, and for the moment it contains some very interesting metrics and visualizations related to StackExchange, so you will only be able to access them if you analyze any tag, let’s see them!
Inside “Activity”, the “Q&A” section shows a couple of metrics and graphs that allow us to know the number of questions and answers of the tags that we have analyzed, as well as their distribution over time. If we want, we can filter by tag (if we have analyzed several) or by period of time.
Within “Community”, the “Q&A” section shows the number of users who have asked questions and answers related to the tags we have analyzed. In this way, we can get an idea of how much community is involved with a specific topic. As with the previous ones, we can filter by tag or time.

This new section is still in development, and we have many ideas about future metrics and graphs, such as the top 10 related tags or the top 10 viewed questions. Of course, if you have any suggestion or proposal, do not hesitate and leave a comment or open an issue to request it!
Cauldron.io Team