Introducing the performance metrics
Cauldron is constantly growing and improving. On the way to the best version in terms of code analysis, we are pleased to announce the new section within project metrics: performance.
This new section allows you to better understand the performance of your favorite projects, with special emphasis on issues and reviews. Let’s see them! (Both sections, the issues section and the reviews section, share the same structure, so we will only take a look at the issues section.)
Metrics
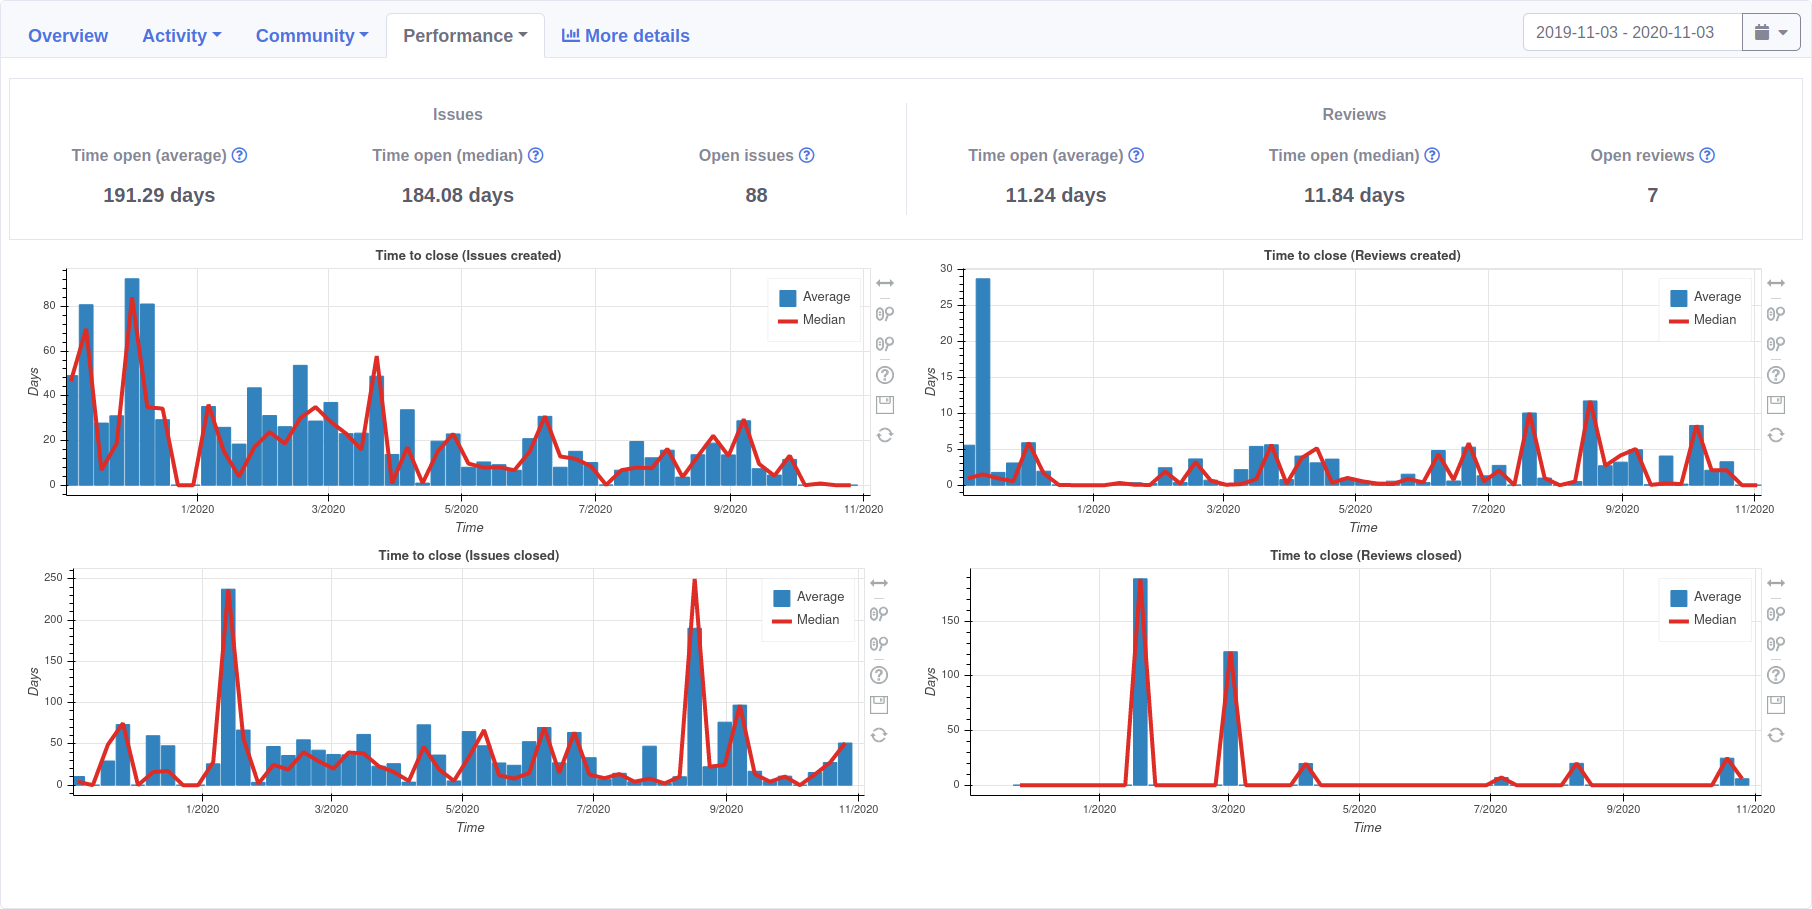
At first, we will see a few metrics at the top: the first one (Time to close) will show us the median time to close for closed issues in the last month, the last year and a comparison between the last two years.
Along with these we find the time (average and median) that the open issues have been in that state, as well as the total number of open issues. These three metrics do not respond (for now) to the temporal filter, so they are only shown for the current time.

Visualizations
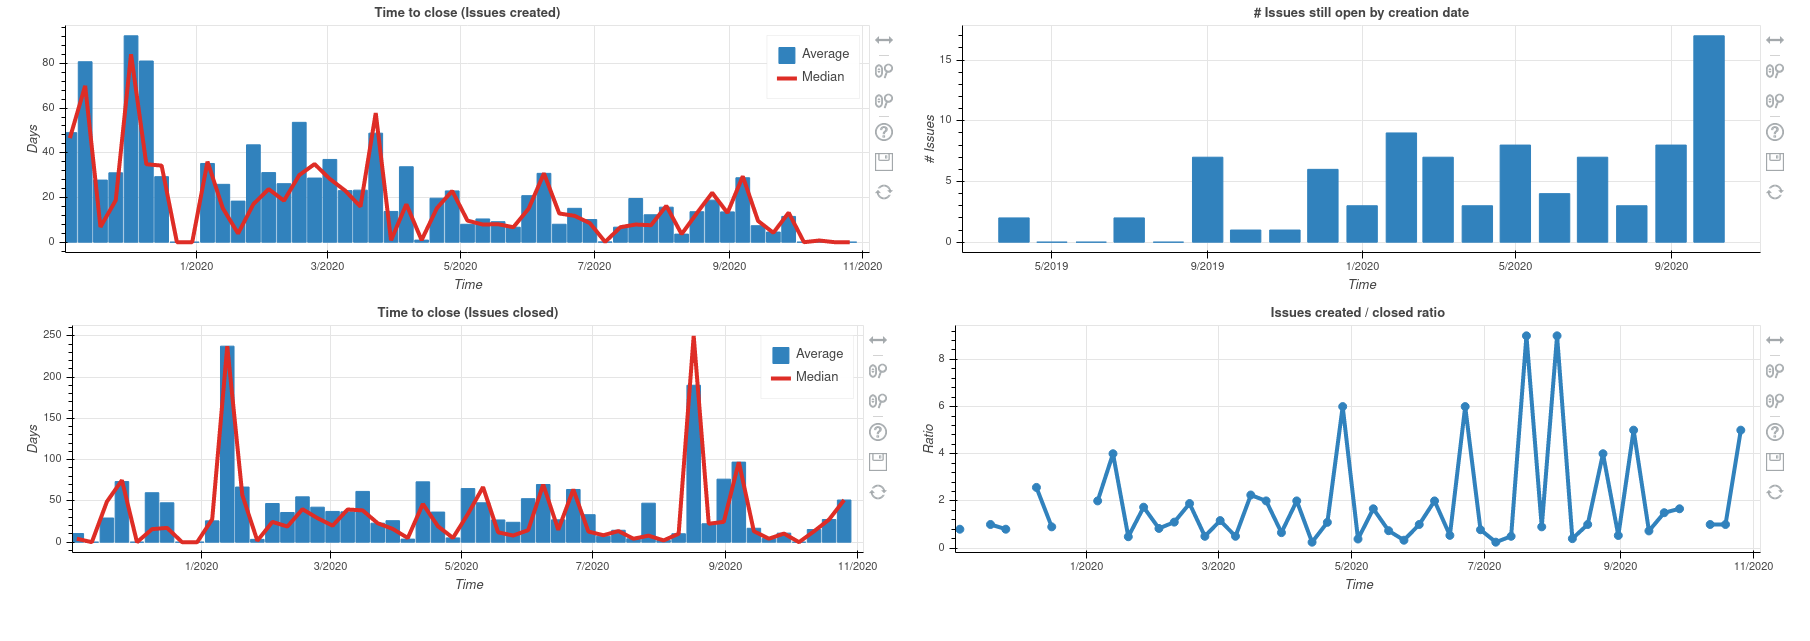
Below we find four new visualizations:
- The first one (top left) shows us in the same graph the closing time (average and median) of the issues created during the selected period of time.
- Just below the previous one (bottom left) we find the same graph, but in this case for issues closed during the selected period of time.
- The third graph (top right) may sound familiar to you, since it is the formerly known as “Open issues age”, which was in the activity section and we thought it fits better in this new section. The graph shows the number of issues currently open, grouped by their creation date.
- The fourth and last graph (bottom right) shows the ratio between the issues created and closed during the selected period of time.
That’s it for now, but there is more to come very soon. We hope that these new graphs and metrics help you even more on your way in analyzing your repositories and organizations.
Please do not hesitate to leave us your impressions in the comments section!
Cauldron.io Team