In the Cauldron.io interface, when I change the timeframe for analysis, the performance metrics don’t change:
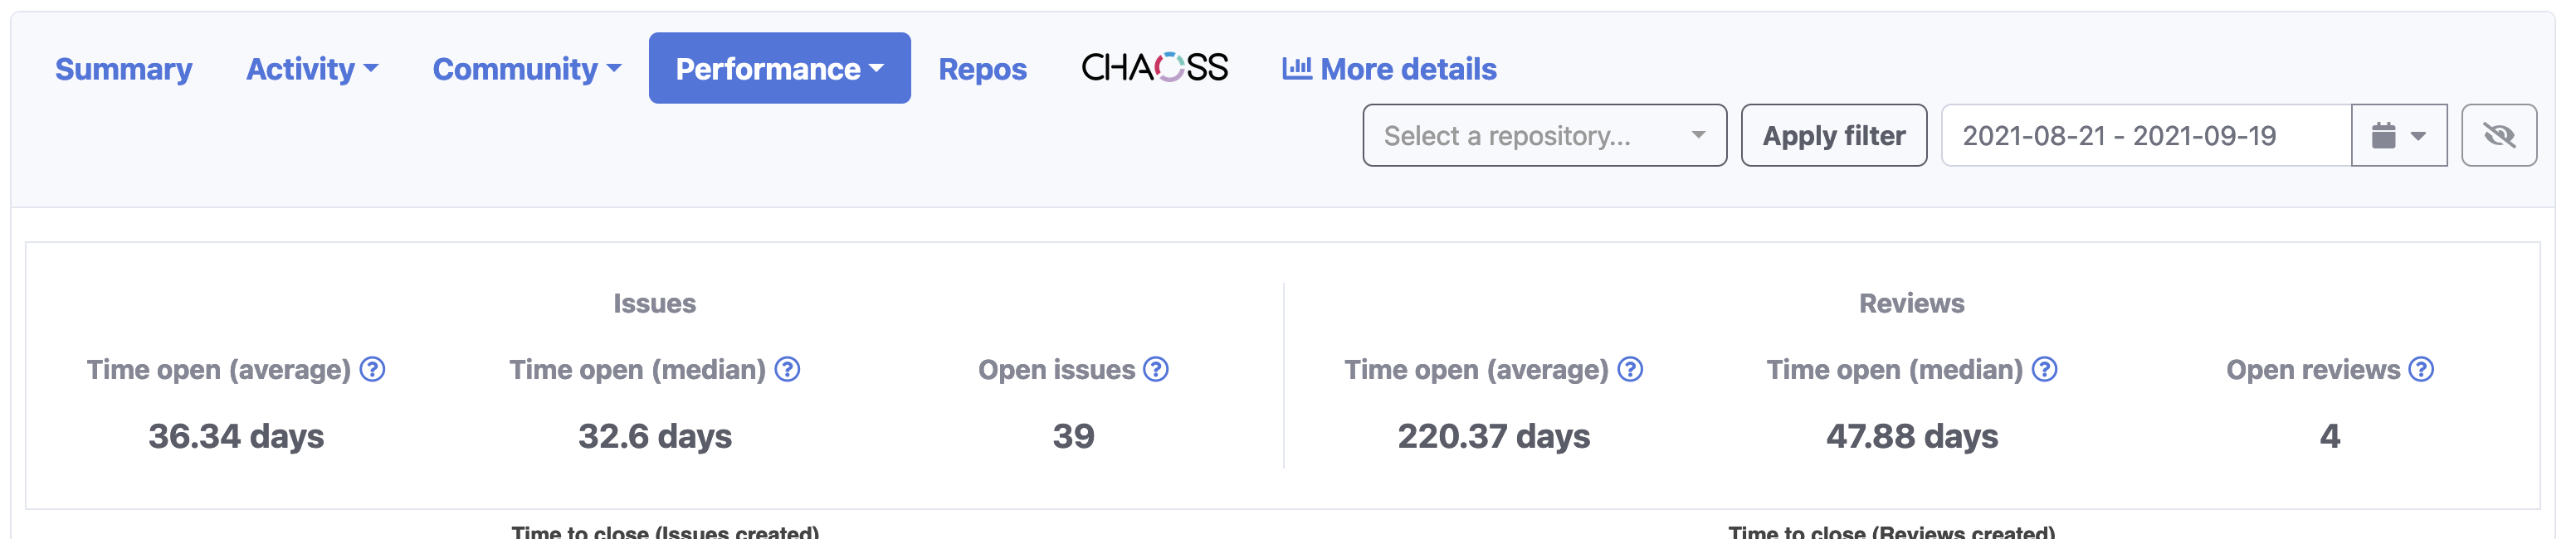
So, I was thinking about how to get the average time to close of issues and pull requests. I found the Efficiency dashboard in Kibana (behind “More details”).
Does the Efficiency dashboard show the average time to close for issues, pull requests, or both?
I assumed it was both and tried to apply the filter pull_request: true and pull_request: false. However, then there was no data left.
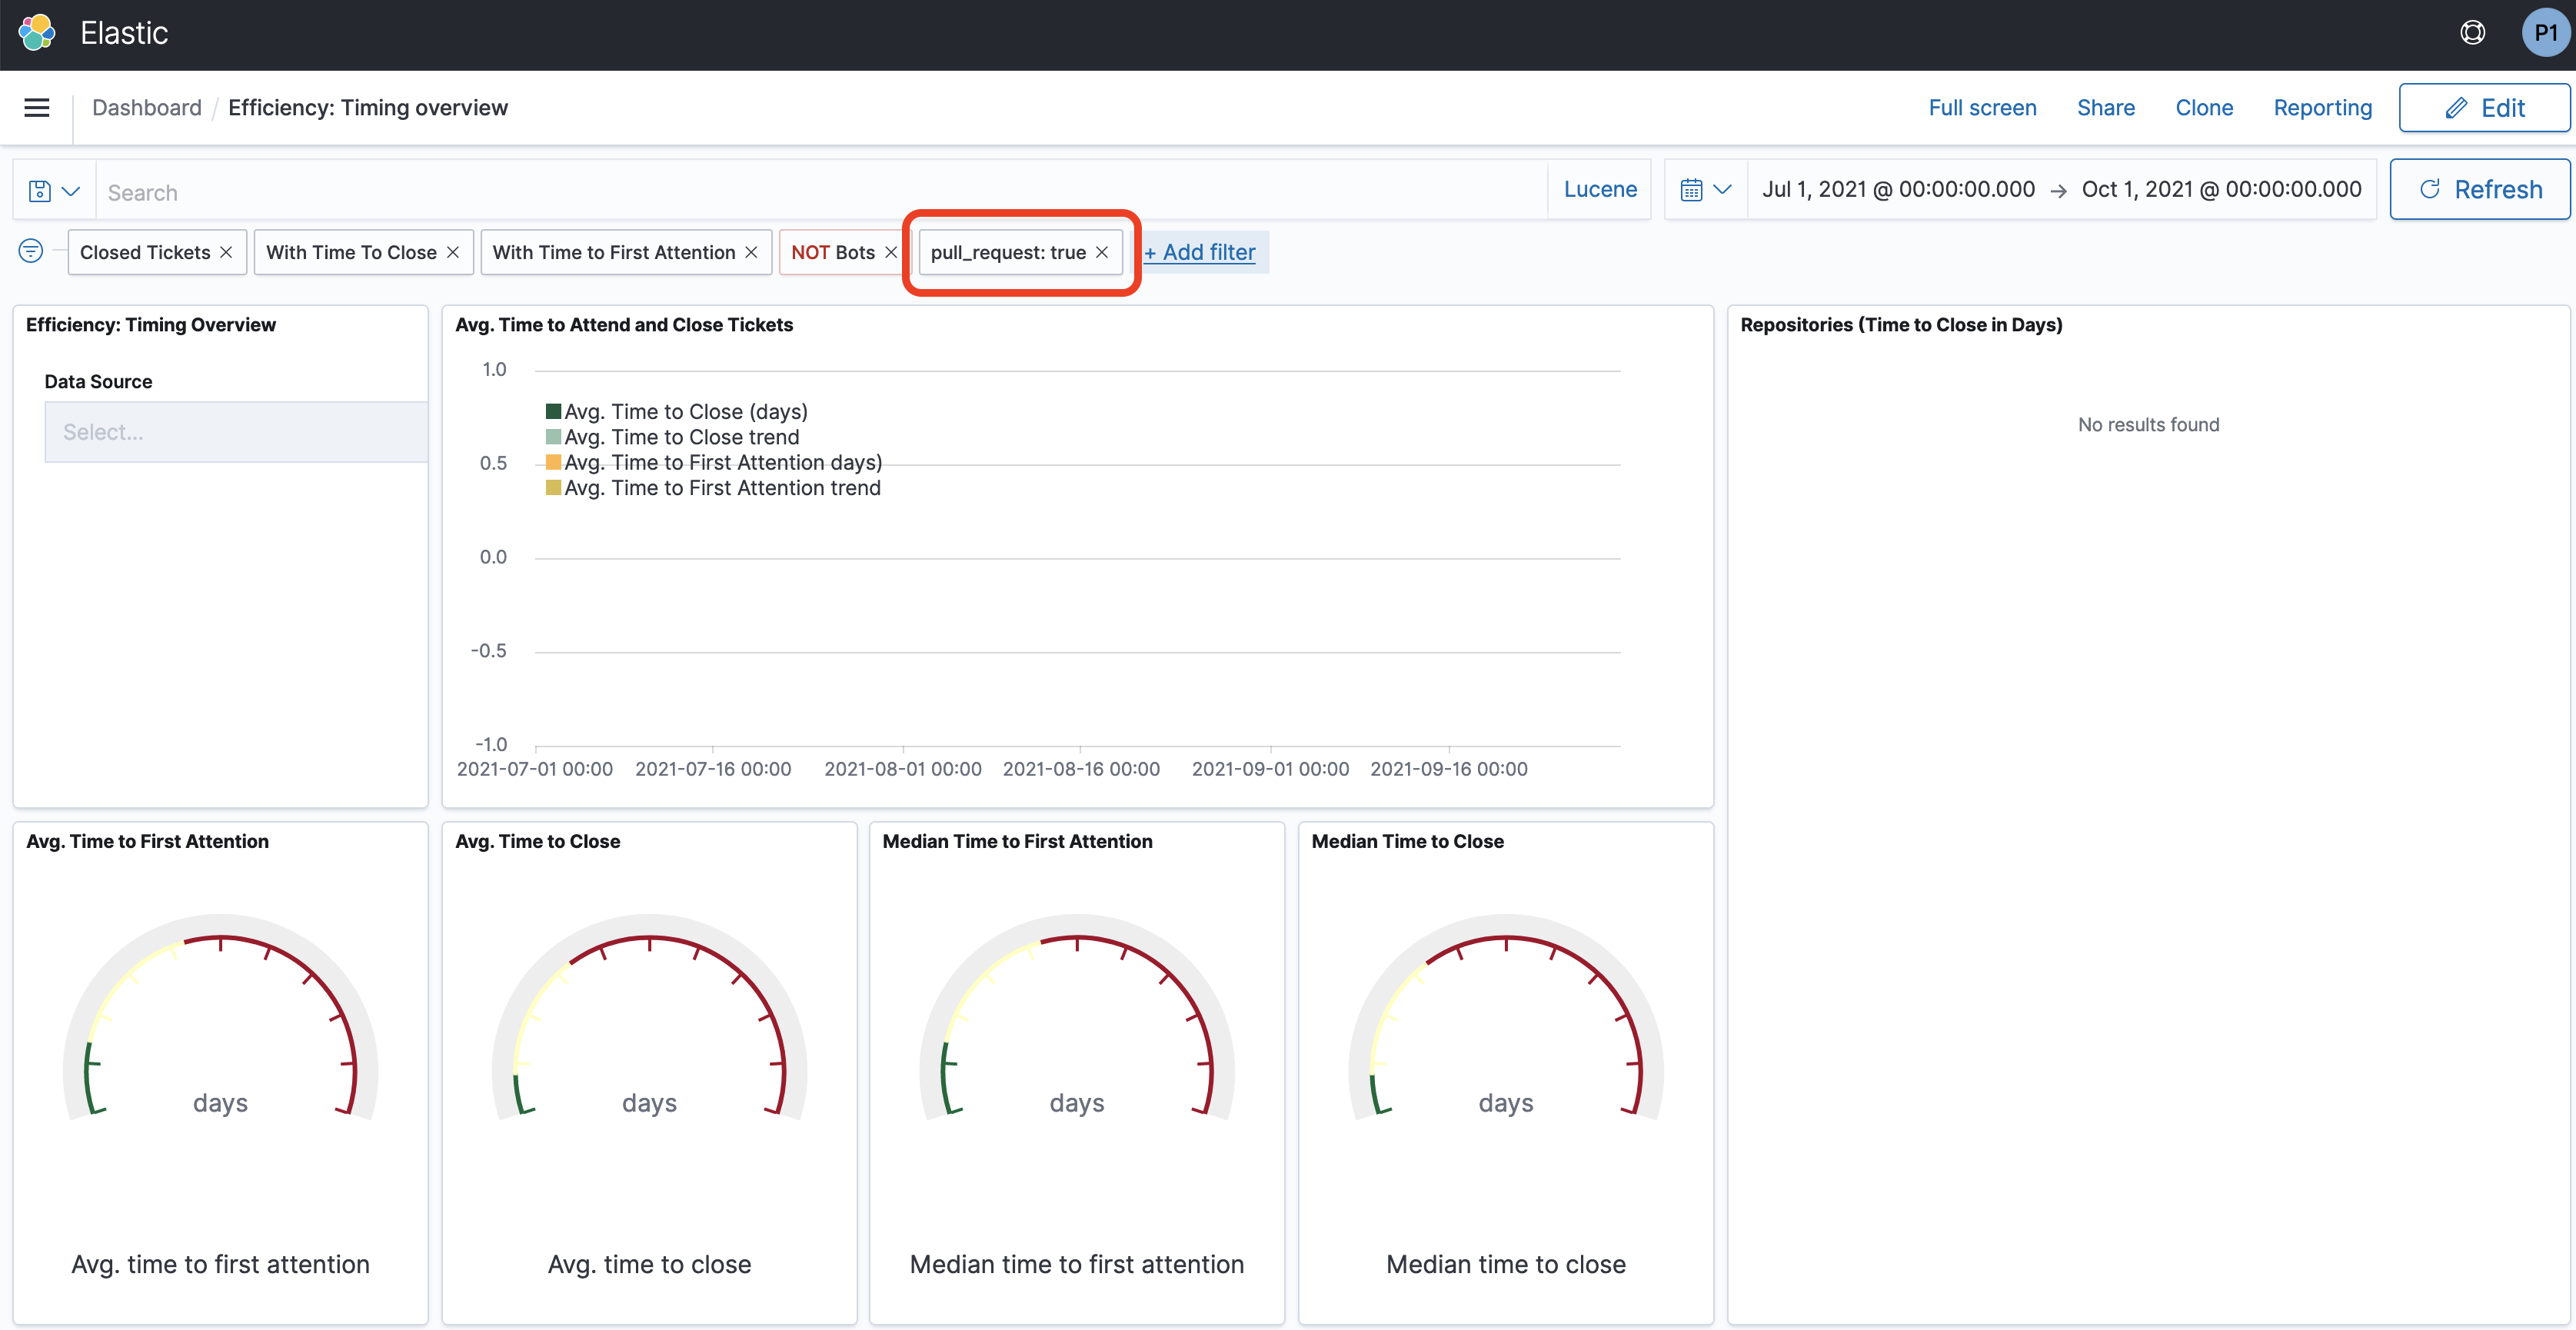
How can I get the average time to close for issues and pull requests (separately) for a specific time window?
The issues and pull requests opened during this time should be counted, regardless of when they were closed. Alternatively, this could show all issues or pull requests that were closed during the analysis time frame, regardless of when they were opened – either is fine, I just want to know which one.
[EDIT:] I just remembered that the report pulls data from GitLab, which does not have pull_requests but merge requests. I guess this would change things? I changed the title to reflect this but not the rest of this post.
